Since the last report two weeks ago, before our half-season break, four picks hit their stops. All were longs. Ironically, the only remaining pick is a short, and it has a minimal gain. I tightened the stop on it. For some odd reason, I suspect that it will get taken out. 😉
The current screen from charts as of the close on Friday, July 9, had a whopping 139 buys and 13 sells. Two of the sells were inverse funds, making the final score Bulls 141, Bears 11. But the kicker is that 7 of the sells were bond funds. There were only 4 equity sell signals out of the total 152 signals. That’s mind boggling.
I took a little vacation last week, so no weekly figures to compare. Before the break, they had been lopsided on the buy side. The market has made surprisingly little upside progress, given the surfeit of buy signals. There’s a lot of noise, and not a lot of direction in these signals.
The enormous bullish spread on Friday would normally suggest thrust, and a new upleg, meaning that this rally would be likely to run for weeks. But, once again, I wasn’t impressed after eyeballing all 152 of the charts with signals. Most looked to be of the rangebound whipsaw variety. I didn’t see that many that appeared to be in an early upmove setup. There were only 5 charts I liked enough to add to the list for this week.
Here are the picks I liked from Friday’s raw data. They’re all longs. The stop levels also represent no-go prices if the these long picks open below their stop.
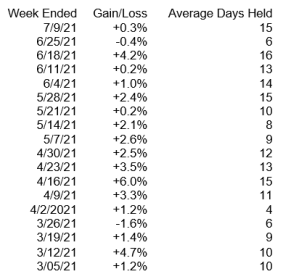
This table summarizes recent list performance. Current charts of new picks are below.
Get the newest pick and review charts of existing picks in today’s report. Technical Trader subscribers click here to download the complete report.

You must be logged in to post a comment.