Menu Close

Category: 2 – Technical Trader

Lee Adler’s proprietary cycle analysis with market trend and position ideas for investors and weekly individual stock swing trade ideas for traders. Click here to subscribe. 90 day risk free trial!

Bullish Signals Abound

Scheduled liquidity data has told us for a couple of months that October would be bullish. That played out like a charm in terms of the technical analysis last week. We also know that liquidity only gets more bullish this week. The technical picture confirms that outlook. We must give the bullish factors the benefit of the doubt.

My stock pick screens confirm that. I’m adding 7 picks from those screens this week, 5 long and 2 short. That will leave 13 open picks, including 11 longs, and the 2 new shorts.

Four chart picks were stopped out last week. Needless to say, all were shorts. The two older picks had nice gains, partly offset by small losses in the short side picks from last week.

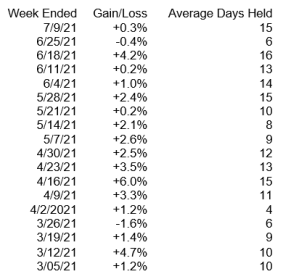
The list performance improved sharply last week as the average holding time increased a bit. Gains doubled from an average 3.2% to an average of 6.4%. The average holding period last week was 20 calendar days, up from 17 days the previous week. The average holding period has ranged from 16 to 22 days, or just over two to three weeks.

Technical Trader subscribers, click here to download the report.

Not a subscriber? Try Lee Adler’s Technical Trader risk free for 90 days!  

Past performance doesn’t indicate future results. There’s always risk of loss. Chart picks are for informational purposes only. These reports are geared toward professional investors and experienced individual traders. Do your own due diligence before trading.

Tick Tock – Market Is a Broken Clock

Mixed cyclicality has led to a rangebound market. There’s no sign that that will change this week. But look out if it does!

Technical Trader subscribers, click here to download the report.

Not a subscriber? Try Lee Adler’s Technical Trader risk free for 90 days!  

The Bulls Are Back

An up day on Monday would confirm that the short term downtrend is broken. This report gives you the key support and resistance levels, and what to expect if they’re broken. I’ve added 8 chart picks, 5 longs and 3 shorts, to take advantage of a move either way.

Technical Trader subscribers, click here to download the report.

Not a subscriber? Try Lee Adler’s Technical Trader risk free for 90 days!  

Bears Have A Chance To Break The Market

An important low is due right now but bears have a chance to break the market. This report shows you the setup and gives you picks to play both ways. Current long/short swing trade chart picks are up 6.9% (100% cash basis) on average, with an average holding period of 3 weeks. This week I added 3 short and 3 long picks. That leaves the list with 6 shorts and 10 longs.

Technical Trader subscribers, click here to download the report.

Not a subscriber? Try Lee Adler’s Technical Trader risk free for 90 days!  

Where There’s Fire, There’s Smoke

The June selloff was 265 points high to low. So far, the current selloff has hit 278. Bigger? Nope, not in percentage terms. This one is -7.7%. That one was -8.2%. So, we can still say that this time isn’t different.

Yet. But there’s smoke. Plenty of it.

Technical Trader subscribers, click here to download the report.

Not a subscriber? Try Lee Adler’s Technical Trader risk free for 90 days!  

This Time Isn’t Different Yet

Here’s why the other shoe hasn’t dropped yet, but where it might.

Technical Trader subscribers, click here to download the report.

Not a subscriber? Try Lee Adler’s Technical Trader risk free for 90 days!  

The Genius Move Was Following the Crowd

Following the crowd would have made you the most money. But now what?

Technical Trader subscribers, click here to download the report.

Not a subscriber? Try Lee Adler’s Technical Trader risk free for 90 days!  

Stocks Breach

A short term top and minor correction are due but intermediate cycles still point higher. We have more stockchart picks to take advantage either way.

Technical Trader subscribers, click here to download the report.

Not a subscriber? Try Lee Adler’s Technical Trader risk free for 90 days!  

Stock Market Rides the Razor’s Edge

The longer intermediate cycles say that the market is heading much higher. Shorter cycles point to more limited upside.  But the whole shebang is fragile as hell. Here’s what to look for, along with some interesting chart picks on both the long and short side.

Technical Trader subscribers, click here to download the report.

Not a subscriber? Try Lee Adler’s Technical Trader risk free for 90 days!  

Signs Point Higher Until September 8

The path of least resistance is still up. Cycle projections say the S&P will make new highs, and not just by a little.

Technical Trader subscribers, click here to download the report.

Not a subscriber? Try Lee Adler’s Technical Trader risk free for 90 days!  

%d bloggers like this: